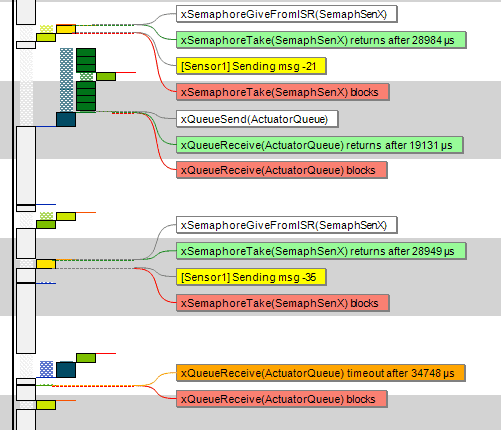
Have you ever tried recording what happens in an RTOS-based firmware to find some bug or tune the performance? You will quickly find that there is a lot of interesting stuff going on, like in the below view from Tracealyzer showing a 50 millisecond section of a much longer trace. There are plenty of interrupts and RTOS events, such as task switches, taking and giving semaphores, and using message queues for passing data in between tasks.
Recording these events will naturally require a recording media of some form. In many cases this is restricted to the on-board RAM, since not all debug probes supports streaming the data to a host computer. Since RAM is rather limited resource in MCUs this only allows for short traces, typically a few seconds at most.
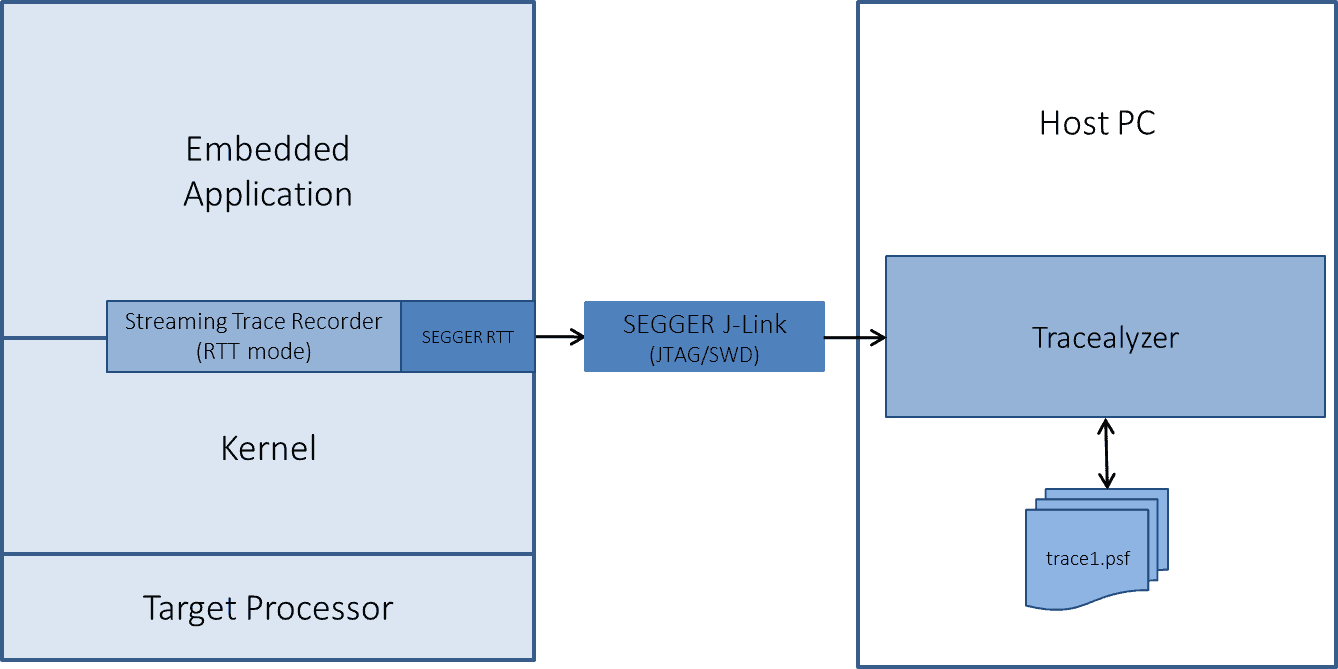
When recording with Tracealyzer there are two main options: to use a RAM buffer on the target (“snapshot” recording), or to stream the data using a SEGGER J-Link probe as illustrated below.
The streaming option will give you almost limitless trace length, as the hard drive on the host PC is used as recording media. An RTOS-level trace recording is typically a few hundred MB per hour, so in theory you can record for many hours without problems. However, the advanced visualizations in Tracealyzer uses a fair amount of RAM when loading a large trace, and currently it scales to viewing about 10-30 minutes of trace before the visual performance starts to suffer. Future versions will however allow for much longer traces.
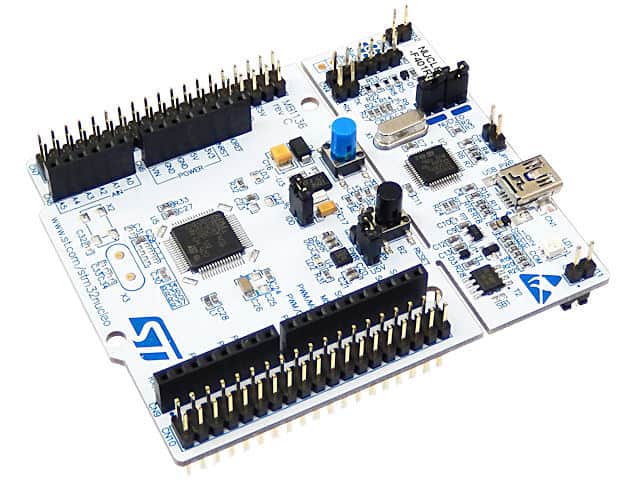
ST offers many development boards for the STM32 MCUs including the Discovery and Nucleo boards, often costing less than a lunch, so many developers have these on their desk. They come with an integrated ST-Link debug probe that allows for debugging with just a USB cable, but they don’t support trace streaming, at least not with acceptable speed. So RTOS tracing with ST-Link has only been possible if using the “snapshot” approach, limited by the available RAM.
But this has now changed. A few weeks ago, SEGGER released a new firmware for these boards that reprograms the onboard ST-Link to a SEGGER J-Link. This can upgrade many ST boards (like the STM32L467 Nucleo board on my desk) into a development platform that supports streaming RTOS trace.
So how do you upgrade the on-board ST-Link into a J-Link?
1) Make sure the ST USB-drivers are installed.
2) Download and install SEGGERs J-Link Software package v5.12b or later
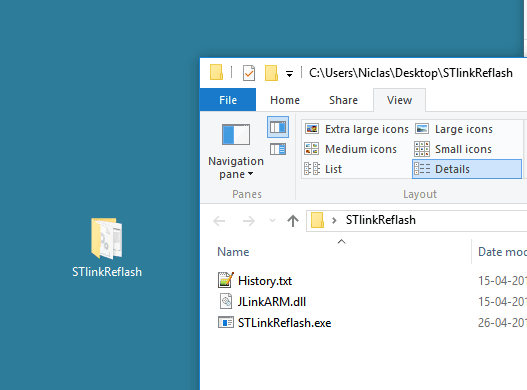
3) Download and run a SEGGER utility named STLinkReflash.
Everything required is found on https://www.segger.com/jlink-st-link.html
Once you download and unzip the files, you’ll notice that the STLinkReflash package includes the JlinkARM dll, so to ensure you use the latest version, replace this dll in the STLinkReflash folder with the newest version installed in step 1, typically found in C:\Program Files (x86)\SEGGER\JLink_[version number].
Next, connect the board you wish to convert to the computer and start the Reflash application. After a couple of button clicks, you get four options, as shown below.
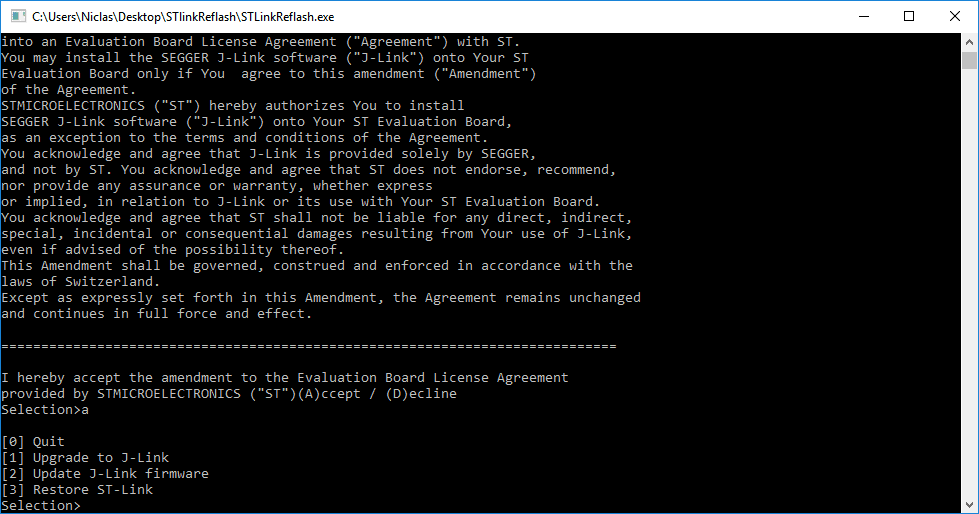
The most interesting in this context is of course Option 1, Upgrade to J-Link. A few seconds later, your ST-Link equipped board is now upgraded with a J-Link probe and supports the unlimited streaming trace feature of Tracealyzer. With streaming trace, you are no longer limited to only viewing only the last few hundred milliseconds of the application behavior. The system I traced here with Tracealyzer and an upgraded ST-Link produces approximately 300 000 events per minute, as can be seen in the below picture. The left window is a live view showing the recording status and a CPU load graph for the target system.
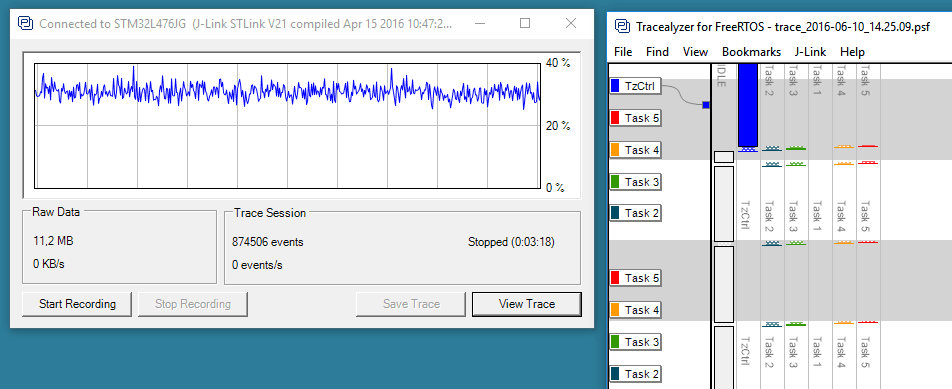
With the 128 KB of RAM, a snapshot recording would be limited to some 20 000 events at most, which is at most 2-3 seconds of trace. When using trace streaming in this example, we easily recorded almost 900 000 events in a trace spanning more than three minutes, using just the on-board ST-Link with upgraded firmware. Which trace do you think gives the best possibilities for solving the problem?
To get started with Tracealyzer for FreeRTOS on STM32, download Tracealyzer and then have a look at the getting-started guide for STM32 users.
Tracealyzer allows you to trace and visualize the execution of RTOS tasks, exceptions (ISRs), and other software events, providing more than 25 interconnected views that gives an amazing visual insight into the runtime world of RTOS-based firmware, accelerating development, validation and debugging. Tracealyzer is available for several common RTOS, including FreeRTOS, SafeRTOS, Linux, VxWorks, Micrium µC/OS-III, and a version for ThreadX will be released during 2016. And there is even a feature-limited free version.
Want to learn more about RTOS-based development and Tracealyzer? More articles here!