This is a part of Tracealyzer Hands On, a series of blog posts with use-case examples for Percepio Tracealyzer®.
When developers are stuck with a tough debugging problem, they’ll often turn to Tracealyzer to help them gain insights into their system so that they can solve the problem. This has led to Tracealyzer gaining the reputation of being a great debugging tool; However, Tracealyzer is so much more than just a debugging tool.
In this blog series, we will examine several additional ways that developers should be using Tracealyzer besides debugging.
First, developers should be using Tracealyzer the moment they setup their software project and begin developing their application. The reason for using Tracealyzer so early is that it will help developers spot bugs and performance issues the moment that they occur! Most users wait until they have a problem to start tracing but if you trace your application periodically through-out development, you’ll immediately spot strange behavior or mistakes during implementation. The result will be less time spent debugging which quickly correlates to less development time and lower costs.
Inspect those black boxes
Next, Tracealyzer can be used to trace embedded platform framework code or software stacks that behave as black boxes in application code. Many developers are starting to use embedded platforms or software stacks that are developed by 3rd parties and could span tens to hundreds of thousands of lines of code. There is no fast and efficient method available to understand how all that code executes and interacts without using a tool like Tracealyzer. Tracealyzer allows a developer to see what that black box code is doing and then properly account for it in their design and implementation.
A great example on how Tracealyzer can be used to understand black box software was recently published by Jacob Beningo in A peek inside Amazon FreeRTOS and A peek inside Amazon FreeRTOS: Communication and memory. In these articles, the author explores the Amazon FreeRTOS demonstration code, which contains little to no documentation, with Tracealyzer to examine and understand how the baseline code executes and functions. Simple information such as how many tasks are in the application are discovered along with more difficult to find information such as malloc and free being called on average more than 350 times per second. Without Tracealyzer, you would either have to examine all the source, a time-consuming endeavor in an application that is ~418 kBytes, or cross your fingers and hope for the best.
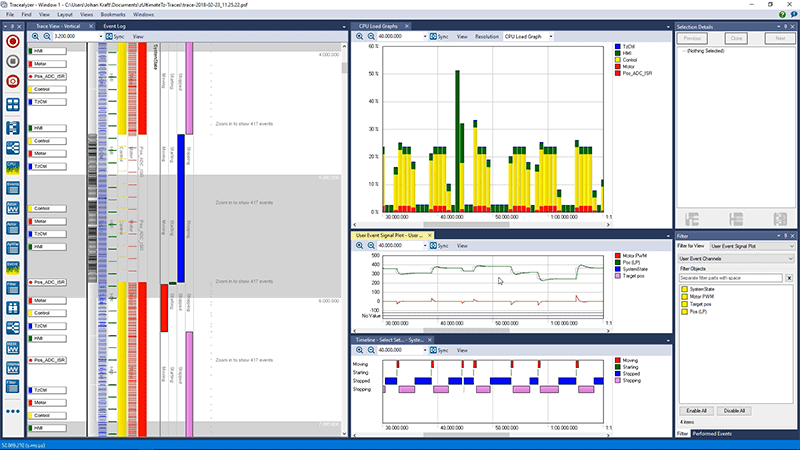
Thanks to its many different views of your application, Tracealyzer can assist you through-out your development process.
Finally, one can use Tracealyzer to reverse engineer a software stack. There may be instances where a piece of software is open source, no longer supported or has major quality issues and the only way to really move forward is to start from scratch. If the software behavior is at least close, a developer could trace the stack and use that as a baseline to compare against the more robust software that is developed to take its place.
As we have started to see through-out this post, Tracealyzer is much more than just a debugging tool. It can be used through-out the entire development process to help developers monitor and understand their application. It can also be used to understand existing software in an efficient manner that doesn’t require digging deep into source code. In the next several posts, we’ll examine Tracealyzer in more detail and understand how to setup and use many of its functions. We’ll also trace several software stacks to understand how commonly used open source software sizes up.