Tracealyzer v4.9.0 is now available for download. Installation on Linux has been greatly simplified and we have improved the overall user experience on Linux. The tracing support for ThreadX and SafeRTOS has also been updated.
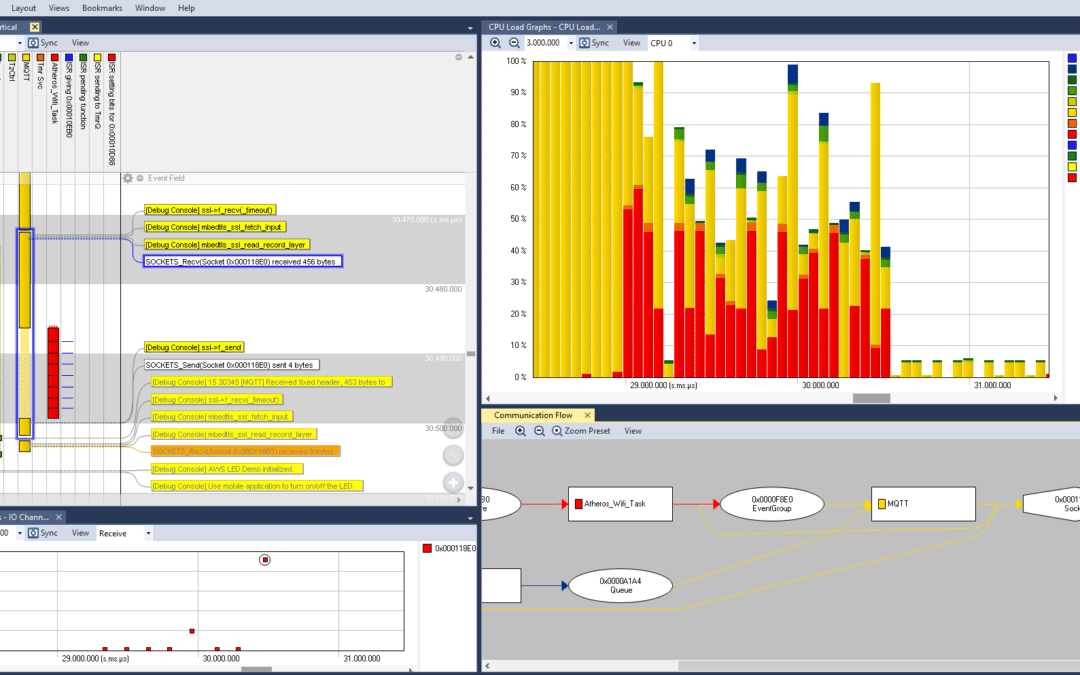
Tracealyzer v4.9 Now Available
read more