This is a part of Tracealyzer Hands On, a series of blog posts with use-case examples for Percepio Tracealyzer®.
A customer asked us if they can use Tracealyzer to detect when a task holds two mutexes at the same time. That could be risky as it increases the risk of deadlock issues, where tasks are locked up in a circular wait.
Yes, there are in fact several ways, and they build upon Tracealyzer’s ability to define and analyze custom intervals in the event stream.
Assuming that you have access to a saved Tracealyzer trace with at least two mutexes, here are some of the ways you could go about this.
Directly in the trace view
 With the trace view open, select “Intervals and State Machines” in the Views menu. The panel that pops up shows any additional data sets that you have defined from the original trace data. In our example trace, it is empty as we haven’t defined any data sets yet, but we’re going to do just that now.
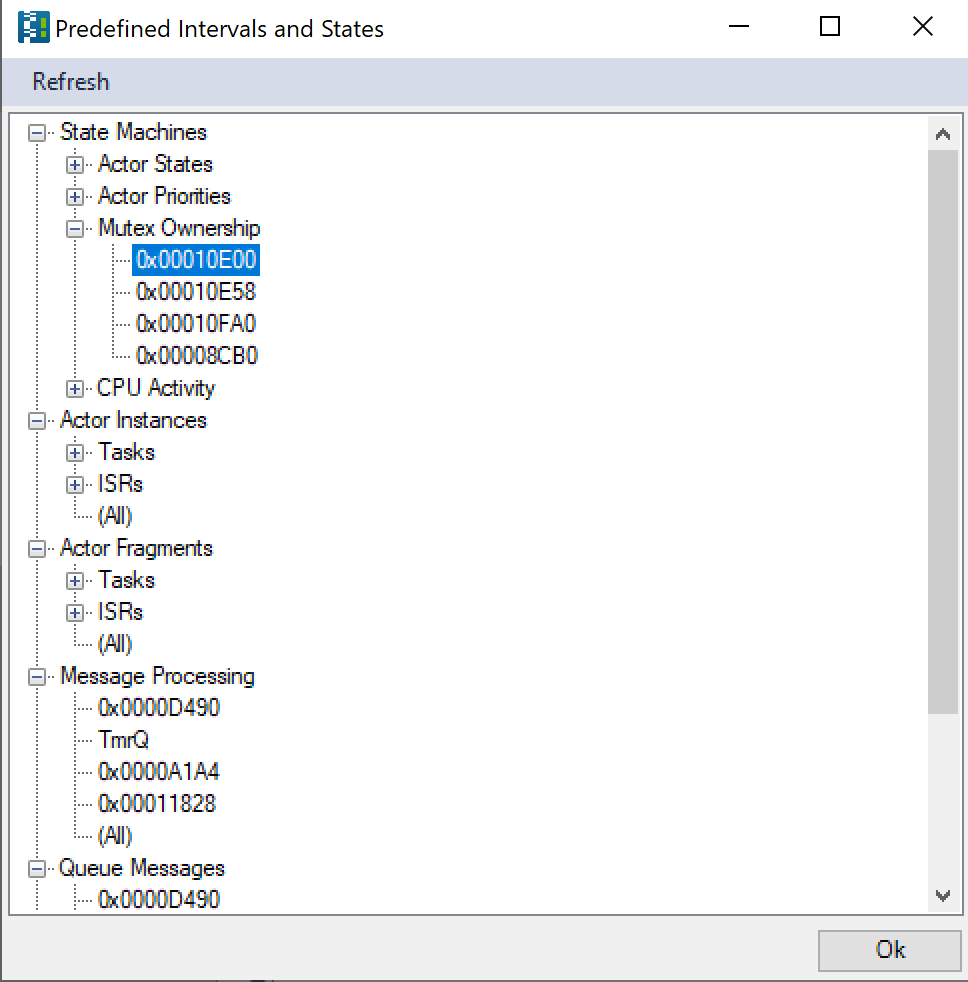
Click the “Add Predefined” button in the bottom of the panel to open another panel with a list of data sets that Tracealyzer automatically has recognized. Among them you’ll see a “Mutex Ownership” group which is exactly what we are looking for. Open the group and add two mutexes to the trace view (you can only add one at the time, so it will take two trips to the “Add Predefined” panel).
Now you should see the two mutexes in the timeline, alongside the visualization of running tasks. The color codes in the mutex views tell you which task holds the mutex at a given time, or if it is unlocked. With a bit of zooming and scrolling around critical points in time, you should be able to spot any place where one task holds both mutexes.
Interval Coverage
You can get an even better overview over when mutexes are used (and this works for other RTOS objects too, like message queues) by looking at the Interval Coverage view – it’s near the bottom of the Views menu. Open an Interval Coverage view, select one of the mutexes we are interested in as the object it should display and then go to its local View menu (i.e. the one inside the view) and select Clone View. This gives you an identical Interval Coverage view which you can then connect to the second mutex.
Arranging the two Interval Coverage views on top of each other, like in the screenshot below, allows you to see when multiple mutexes are locked and by which task. Once again, you will probably have to zoom and scroll a bit to find the right spot.
Computed Overlap
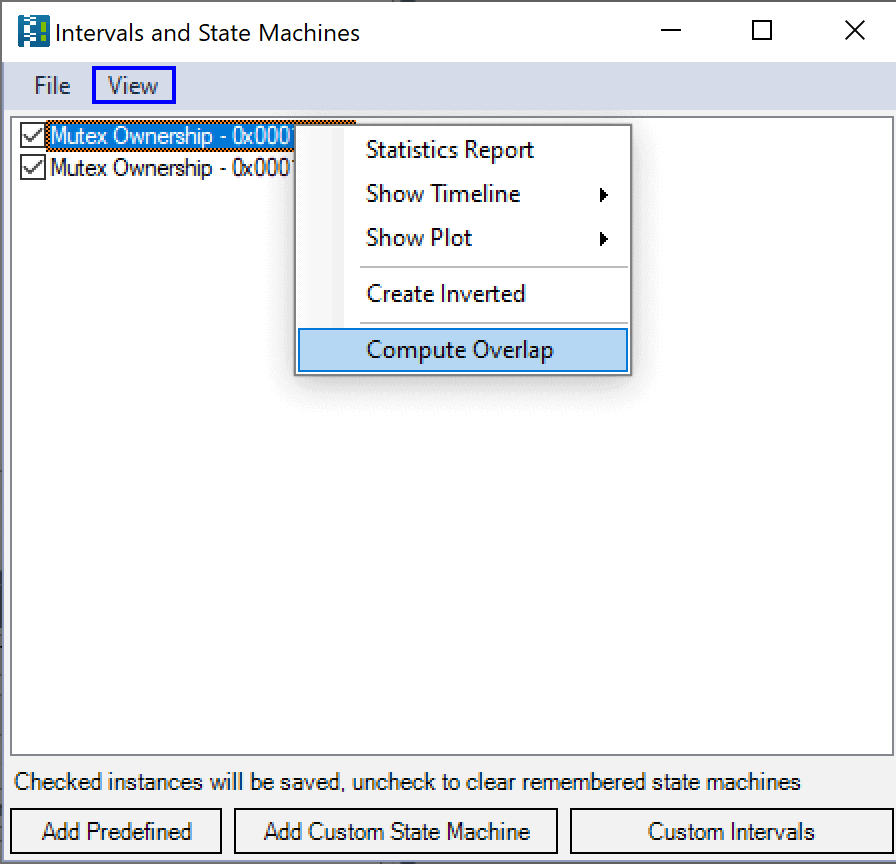 Finally, Tracealyzer has a dedicated “Compute Overlap” function that not only tells you if mutexes are locked at the same time but also how often overlaps occur and how many percent of execution time they represent. Start with the Intervals and State Machines view and right-click one of the mutexes. Select “Compute Overlap” in the pop-up menu and next you get to select a second data set for the overlap computation – pick the other mutex and click OK.
You will see a report in this style, with one sub-table for each task that locks the first selected mutex. Looking at the top table, we can see that during the time that mutex #1 is locked by the AWS_MAIN task, mutex #2 is unlocked 100% of the time so clearly no overlap there. The next table tells us that there is a small overlap, but between different tasks: while mutex #1 is locked by MQTT, the Atheros_Wifi task sometimes locks mutex #2. If the MQTT task had locked both mutexes at the same time, there would have been a row labeled “MQTT” in this sub-table as well.
The conclusion then is that no, in this example application no task locks both mutexes at the same time. So there is no risk of deadlock issues, at least not from mutexes.