This is a part of Tracealyzer Hands On, a series of blog posts with use-case examples for Percepio Tracealyzer®.
In this post, we will explore how to use Tracealyzer to verify the task timing and scheduling of an RTOS application.
The first tool one can leverage to verify task timing is the Actor Statistics Report. This report allows a developer to quickly gauge information about every task in the system such as:
- CPU Usage
- Execution times
- Response times
- Periodicity
- Separation
- Fragmentation
The execution and periodicity values can be extremely interesting to developers who are working to verify a timing model or who just want to measure the system timing. The Actor Statistics report can be accessed by:
- Clicking the Views menu
- Clicking Actor Statistics Report
- Selecting the desired tasks
- Checking the desired data such as CPU Usage, Instance Periodicity, and so on
- Pressing Show Report
The report data selection window presents you with all the options that can be seen in the image below.
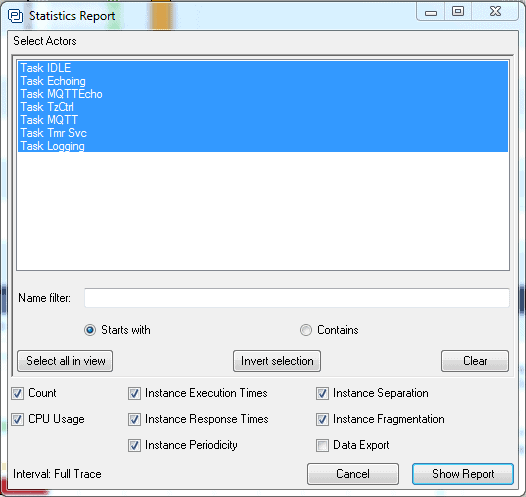
The generated report may look a little bit different based on what data you are interested in. For example, generating a report for the Amazon FreeRTOS demo that includes CPU usage, execution and response times result in the following report.
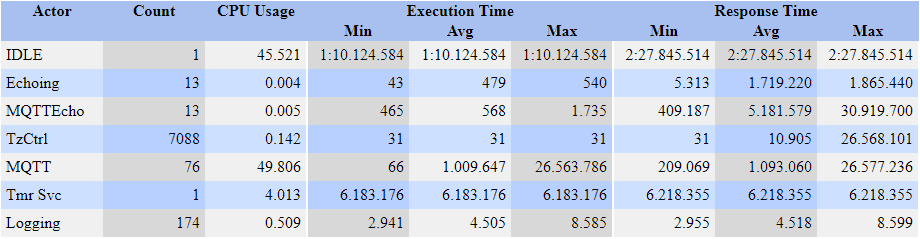
Notice how quickly we can get critical information from this trace data. We can immediately see that through-out the entire trace, the IDLE task is utilizing 45.521% of the CPU. This tells us that there should still be room for us to expand our application if it is done in the right way. What really stands out is that the MQTT task is using approximately 50% of the CPU! From the report, I can immediately ask whether this makes sense or whether there is something not right with the way MQTT is implemented.
Min, max and average execution times
We can also examine how long each task is executed from a minimum, average and maximum standpoint. I have always found it useful to review the spread between these and make sure that the minimum and maximum times make sense for the application. For example, I would not expect much variation in the MQTTEcho task which we can see varies between 465 and 1735 microseconds. On the other hand, I may look at the MQTT task which varies from 66 microseconds to 26 seconds! Something about this task seems very fishy if it is executing for 26 seconds, which lets me know that I need to dive in and further investigate what is happening with this task.
A second tool that you can use to help determine whether the timing on your tasks is enough to be scheduled successfully is the CPU Load Graphs. The CPU Load Graphs can tell a developer if they are getting close to maxing out the CPU at any point during the execution cycle.
The CPU Load Graphs can be accessed using the following steps:
- Click Views from the main menu
- Click CPU Load Graphs
- If you want the graph to be synchronized to the other views, click sync
For the Amazon FreeRTOS demonstration, the CPU Load Graphs appears as follows:
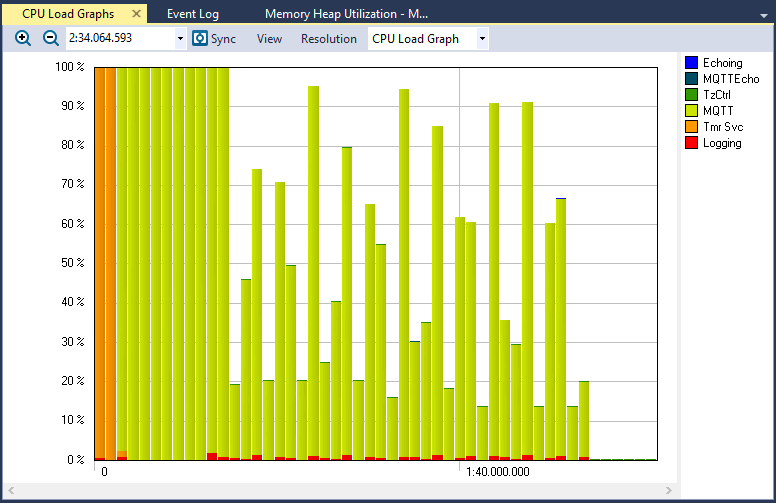
Just by glimpsing at this graph we can see that there are periods during the trace where the CPU was struggling to keep up. First, right at start-up, the CPU is at 100% utilization for approximately 37 seconds. Any attempt to add additional code during this period will result in schedules not being met (and they may not be met at the moment either). We can also notice that the main culprit appears to be the MQTT task. Again, multiple views seem to be suggesting that there is something going on with this task that requires further investigation.
Looking at the rest of the CPU Load Graphs shows that there are periods when the MQTT CPU utilization spikes. Since this application sends and receives data from Amazon Web Services (AWS), this most likely corresponds to those communication points. Again, providing us with some insights that if more code is going to be added to this application, we will need to carefully coordinate with the MQTT task to make sure that all deadlines are met.
Armed with the data from the CPU Load Graphs and the Actor Statistics Report, we can use run-time data to determine whether our application code is indeed meeting the real-time deadlines and responses that we designed it to meet. These views can be critical in catching unexpected behavior and discovering potential issues within the code without having to wait for a bug to present itself.
Explore these features
If you are interested in experimenting with the features we have discussed in this post, you can download an evaluation of Tracealyzer here including pre-recorded demo traces so you can get started right away.