This is a part of Tracealyzer Hands On, a series of blog posts with use-case examples for Percepio Tracealyzer®.
Tracealyzer can automatically visualize how an RTOS-based application is behaving, which is a huge improvement over the “hope and pray” approach often used by developers. But what about events that don’t automatically show up? What if you want to visualize some application data, measure the time between two events or monitor how a state machine in the application is behaving? In this post, we will start to examine how you can set up such logging in FreeRTOS and view this information using Tracealyzer. Note that this post assumes you have already done the basic integration of the trace recorder library in FreeRTOS, as described in the Tracealyzer user manual.
The first step to visualizing custom information that is specific to your application is to create a user event channel. This is basically a string output channel that allows a developer to add their own custom events, called User events in Tracealyzer. For example, if I wanted to transmit sensor event data, I would first create the channel using the following code:
TraceStringHandle_t MyChannel = xTraceRegisterString("DataChannel");
In case your compiler does not recognize this function, you need to #include "trcRecorder.h"
This function registers a user event channel named DataChannel in the trace. This makes Tracealyzer show a checkbox for this channel in the filter panel, so you can easily enable/disable the display of these events. Next, I am able to use either the xTracePrint() or xTracePrintF() functions to record my event data. I could transmit fixed string messages using xTracePrint as follows:
xTracePrint(MyChannel, "Button Pressed!");
Notice that we need to include the channel as the first parameter and then we issue our fixed string. If we wanted to record variable values, such as changing sensor data, we could use the xTracePrintF() function as follows:
xTracePrintF(MyChannel, "Sensor Data = %d", SensorData);
While the format specifiers (%d etc.) are similar to the classic printf function, xTracePrintF is separate implementation where most of the heavy lifting is done in the Tracealyzer application and it does not yet support all the numerous “printf” options. Specific documentation can be found in trcPrint.h.
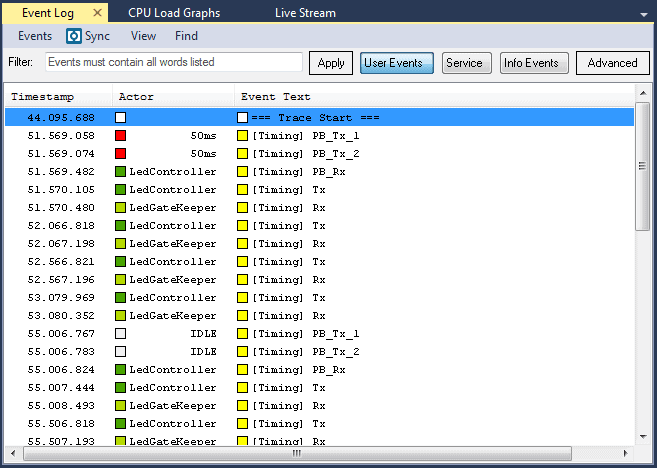
Once the user event tracing is set up, we can record a trace containing both FreeRTOS events and the new user events from the application code. For example, if I recorded events from a push button (PB_Tx_1, PB_Tx_2) along with transmit and receive events (Tx, Rx) to understand my system timing, I can filter the event log for User Events and might see something like the following.
User events via xTracePrint or xTracePrintF are typically much faster than a classic printf because the real formatting is done in the host-side Tracealyzer tool, not in runtime. Further, xTracePrint is faster than xTracePrintF since the latter needs to scan the string to count the number of arguments. There are also other functions that are even faster. Check out this performance comparison for more details.
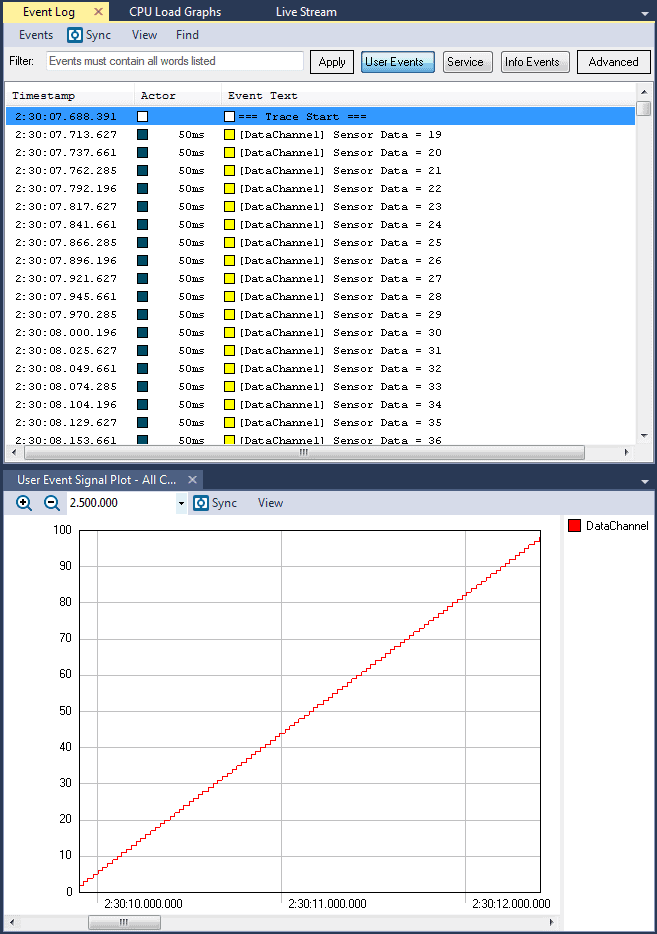
This is also a great way to visualize data from the system. For example, if I have an ADC that is sampling a sensor and I expect to see the data ramp up over a period of time, I can log that sensor data (as we have already seen) and then graph it using the User Event Signal Plot! All I need to do is run my system and open the User Event Signal Plot and I would expect to see something similar to this.
Once we have a user event channel set up, we can start to consider the time between events – in Tracealyzer known as intervals. An interval represents the time between any two events in the trace, such as a button press and a button release. Intervals can be defined for any kind of event, whether we decide to use kernel events such as giving or taking a semaphore or a user event like the ones we just defined. Intervals can be extremely useful to understand important events in our system such as:
- How long it takes to get from point A to point B in a system (perhaps the time between when a USB device is plugged in and the USB stack is ready to use)
- The execution time of a certain function
- The time required to start-up the system
As you can image there are limitless possibilities that we may be interested in examining within the system. From the developer perspective, at a minimum, we can use xTracePrint() to create “Begin” and “End” events that we can then use to define our own custom intervals.
Intervals are defined in Tracealyzer using the “Intervals and State Machines” view. The steps are as follows:
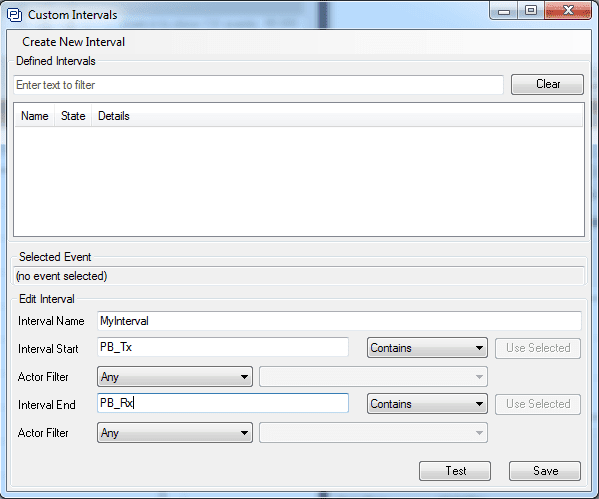
- Click Views -> Intervals and State Machines
- Click Custom Intervals
- Provide an Interval Name
- Enter the text associated with the starting event, such as PB_Tx
- Enter the text associated with the ending event, such as PB_Rx
- Click Save
You’ll notice that the new interval “MyInterval” gets added to the Trace View, highlighting the time between the PB_Tx and PB_Rx events, as shown below:
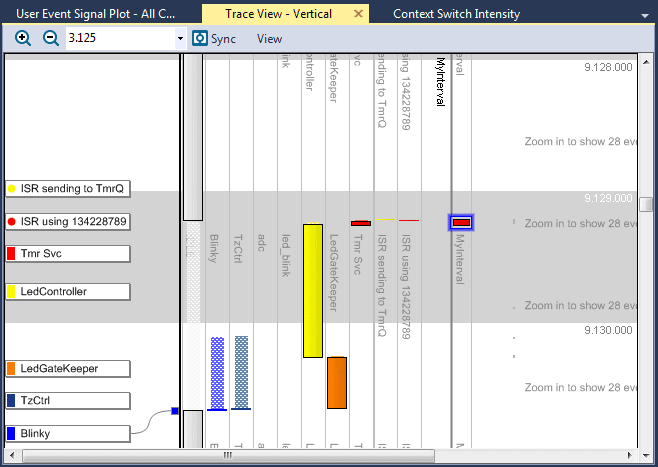
You can show any number of intervals in parallel to highlight important parts of your code, as long as there are corresponding events in the trace.
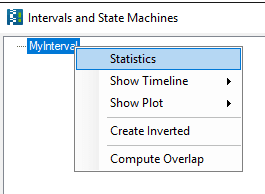 It is also possible to get statistical information on all occurrences of an interval such as min, max, average time, etc. If you right-click on the interval entry in “Intervals and State Machines” view, you will find further options like “Statistics” and “Show Plot”.
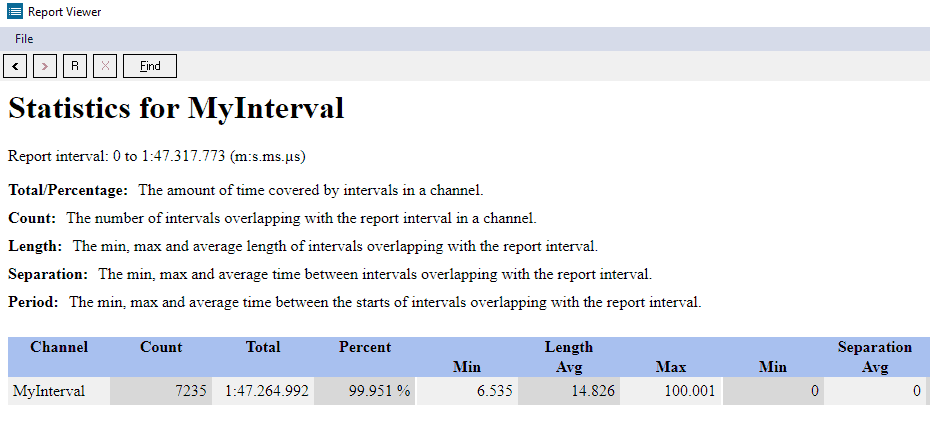
The “Statistics” option gives you a report with descriptive statistics of the interval durations, like the one shown below. Here you can see the longest and shortest durations of all such intervals in the trace, as well as other metrics like separation and periodicity. All min/max values are actually links, so when you click them Tracealyzer will show you the corresponding location in the trace view.
To see more detailed information about the intervals, select “Show Plot” instead. This shows a plot over time, where X is the timeline and the Y-axis shows the duration of each interval, like in the example below showing 10 short intervals (around 5-10 ms) followed by three 100 ms intervals.

In the next post, we’ll explore the concept of intervals further and see how they can be applied to examining state machine data from our system.
An Expert Tracealyzer Tip
When defining a custom interval, notice the Test button. This counts the number of hits in the trace and can be used to verify that your interval definition is correct.