There have been significant improvements in Tracealyzer over the last years. If you haven’t tried it in a while—or if you’re just getting started—here are some tips and tricks that can be handy when analyzing your FreeRTOS applications. As you may know, the...
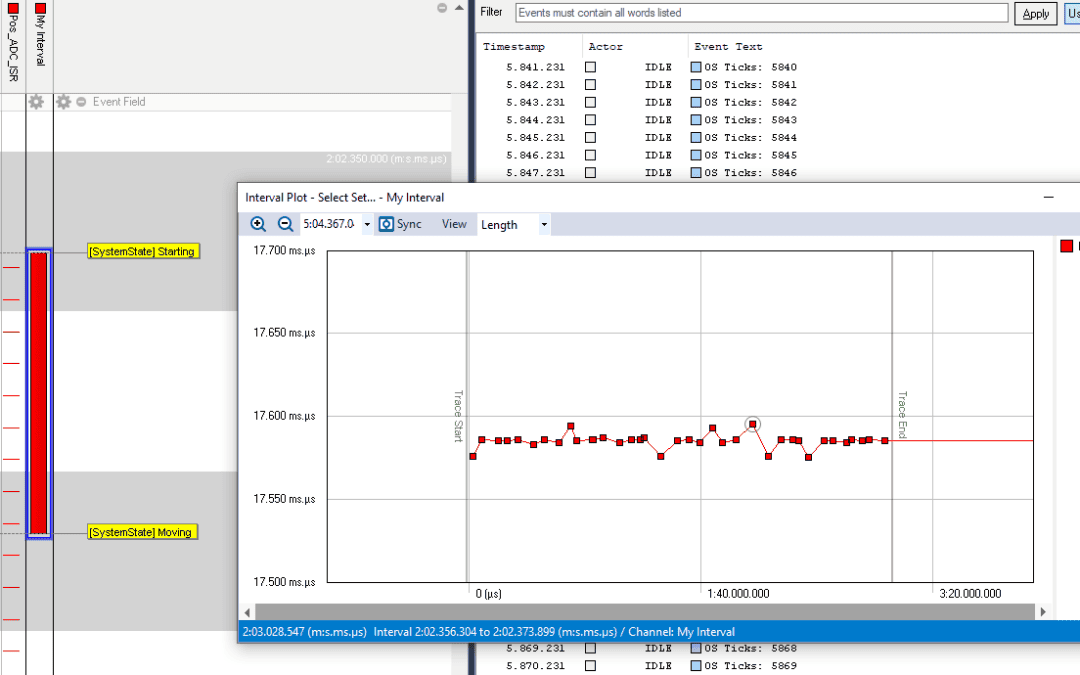
Tracealyzer Tips and Tricks
read more