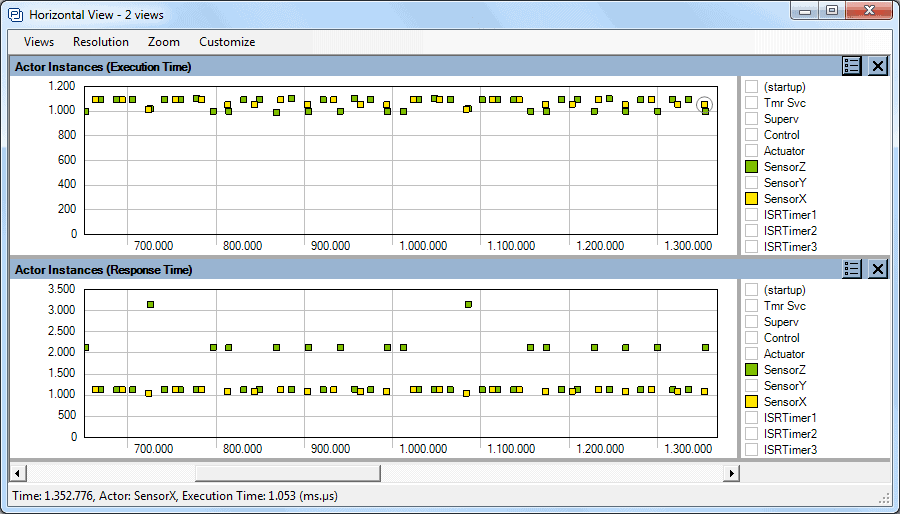
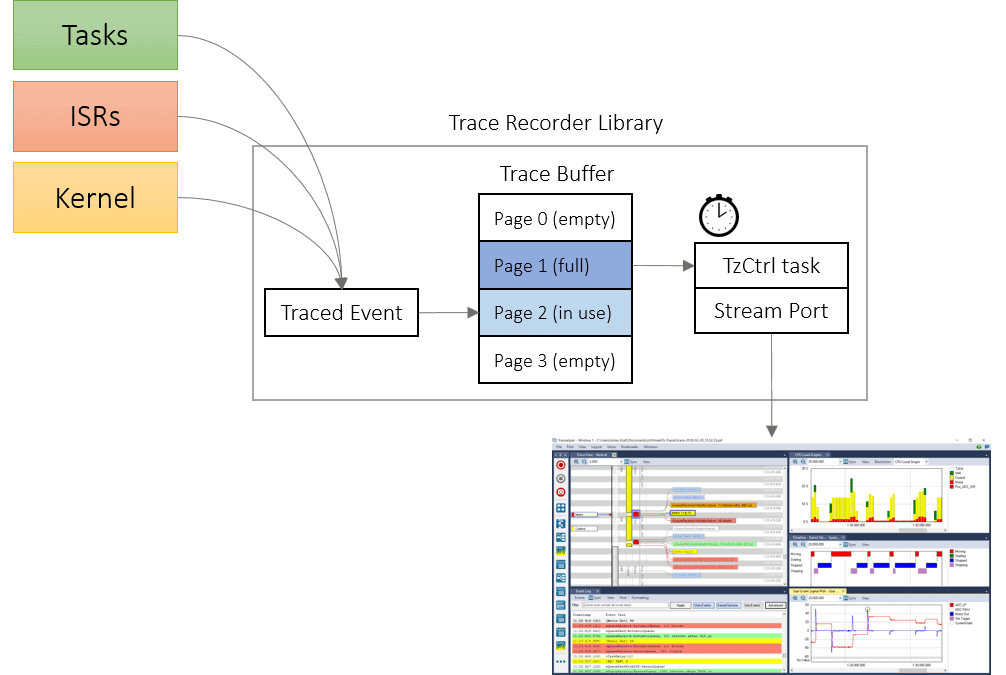
In this blog post, we will see how Tracealyzer can be used to quickly and efficiently evaluate multiple implementations of an algorithm in Python, a language that is becoming more common in embedded application development as most machine learning frameworks are implemented in Python.
In this post, we’re going to understand how the combination of LTTng and Tracealyzer can shine light on how compiler options impact performance. The method discussed can come in handy whenever we are evaluating the performance of multiple candidate implementations of a particular feature.
Read the new Percepio Application Note PA-033 to learn how to leverage the ITM support using a Lauterbach TRACE32/µTrace debugger for visual trace diagnostics and analysis in Tracealyzer.
In this blog post, we’re going to demonstrate how to create LTTng tracepoints and how to use Tracealyzer for Linux to measure certain metrics based on these tracepoints.
Your organization can get to market faster with higher-quality products when given better insight into the “dark side of the code”—the actual behavior of the full software system. Intended and actual behavior may differ in myriad ways that are not apparent from the source code.
The real test of IoT devices comes after shipping, when thousands of end users start using your product, sometimes in unexpected and untested ways. No software is entirely bug free, so some users will run into those remaining bugs. The question is how many and what you do about it.
When developing an application that’s targeting a Linux-based system, it is important to configure our system to maximize performance, because misconfiguration can limit application performance.
One of the biggest problems in embedded development today is understanding what a software stack or demo that you didn’t write is doing. In this post, we’ll examine how we can find this out using the Tracealyzer communication flow diagram.
Quite a few embedded software developers don’t know whether their applications meet their timing requirements. In today’s Tracealyzer Hands On post, we will explore how to use Tracealyzer to verify task timing and scheduling.
Have you ever seen your embedded system behave strangely and had that sinking feeling that you might have a memory leak? Tracealyzer offers several different methods to detect memory leaks.
We serve cookies. If you think that's ok, just click "Accept all". You can also choose what kind of cookies you want by clicking "Settings".
Read our cookie policy