Read the new Percepio Application Note PA-033 to learn how to leverage the ITM support using a Lauterbach TRACE32/µTrace debugger for visual trace diagnostics and analysis in Tracealyzer.
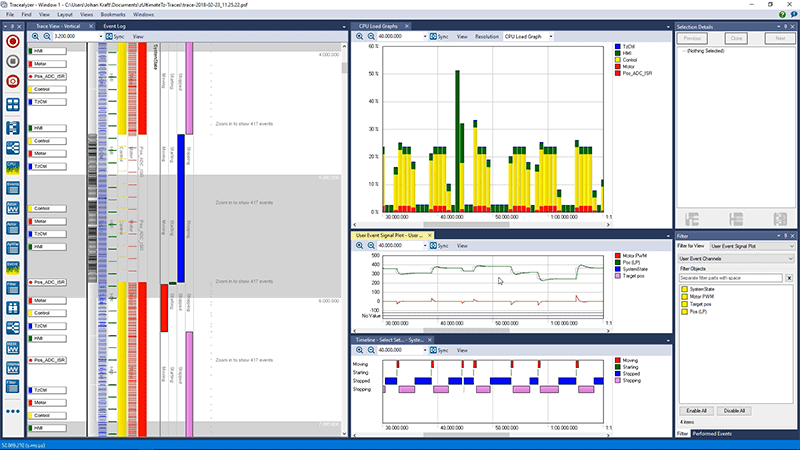
Percepio announces Tracealyzer Tracealyzer version 4.4.2, with support for symmetric multiprocessing systems running Azure RTOS ThreadX SMP. The new release also brings improved support for trace streaming over STLINK-V3 debug probes.
One of the biggest problems in embedded development today is understanding what a software stack or demo that you didn’t write is doing. In this post, we’ll examine how we can find this out using the Tracealyzer communication flow diagram.
Quite a few embedded software developers don’t know whether their applications meet their timing requirements. In today’s Tracealyzer Hands On post, we will explore how to use Tracealyzer to verify task timing and scheduling.
Have you ever seen your embedded system behave strangely and had that sinking feeling that you might have a memory leak? Tracealyzer offers several different methods to detect memory leaks.
What if you want to visualize some application data in Tracealyzer, measure the time between two events or monitor a state machine? In this post, we will show how you can set up this kind of custom logging.
Within Tracealyzer’s trace view, tasks, events and state machines are now organized into view fields, collections of tasks, intervals or events. In this post, we are going to examine how you can use those views to simplify working with Tracealyzer.
We serve cookies. If you think that's ok, just click "Accept all". You can also choose what kind of cookies you want by clicking "Settings".
Read our cookie policy