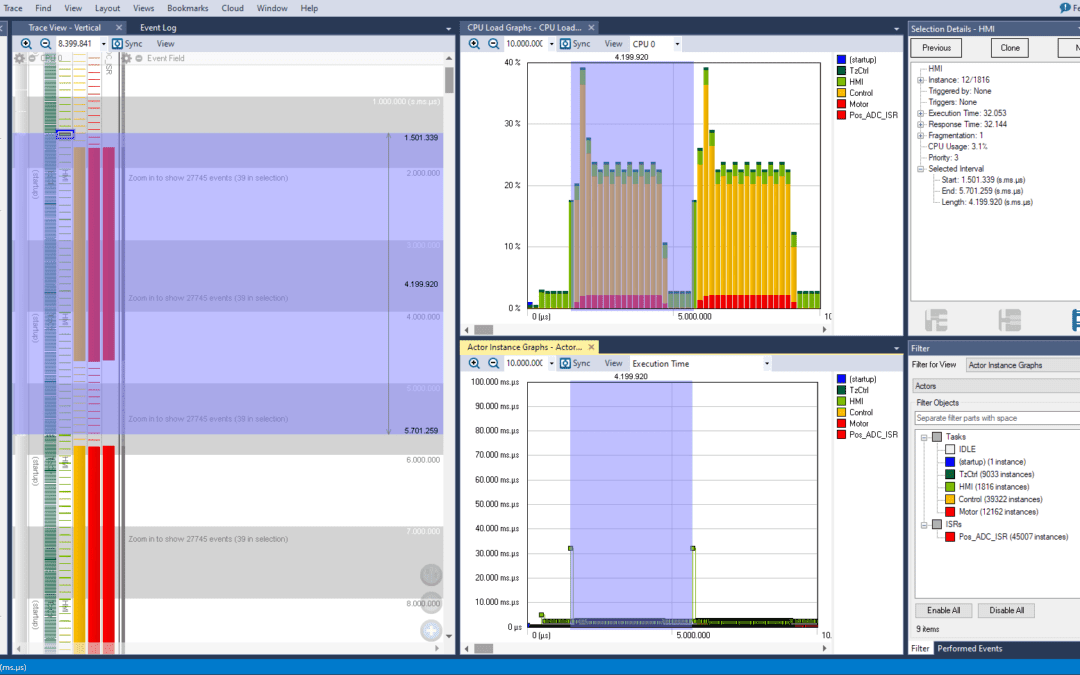
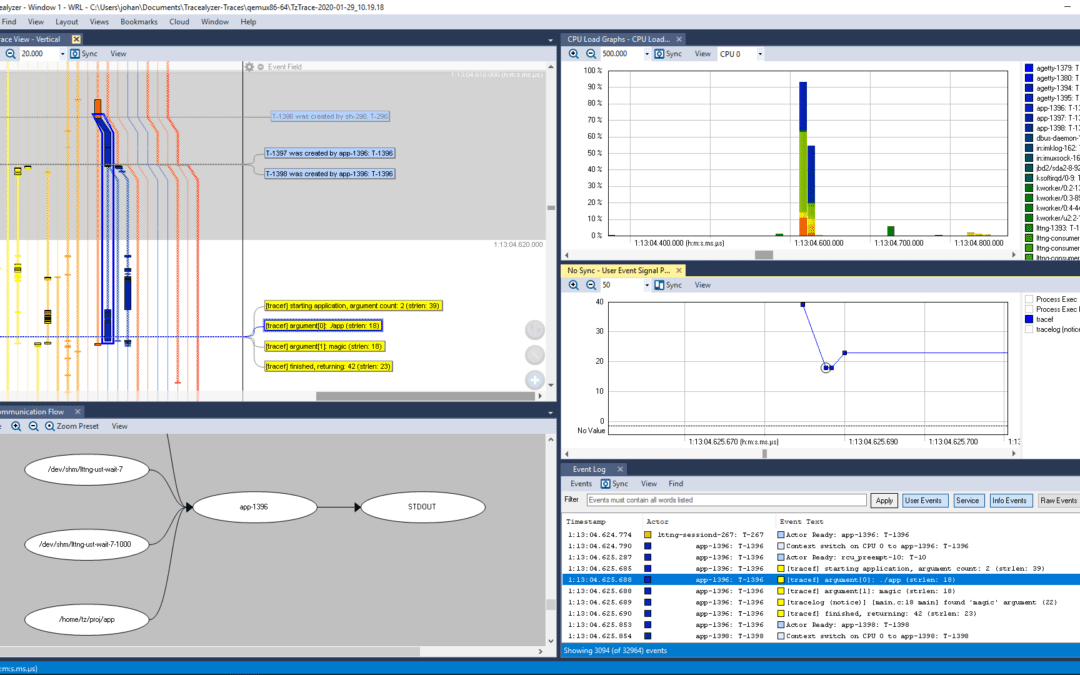
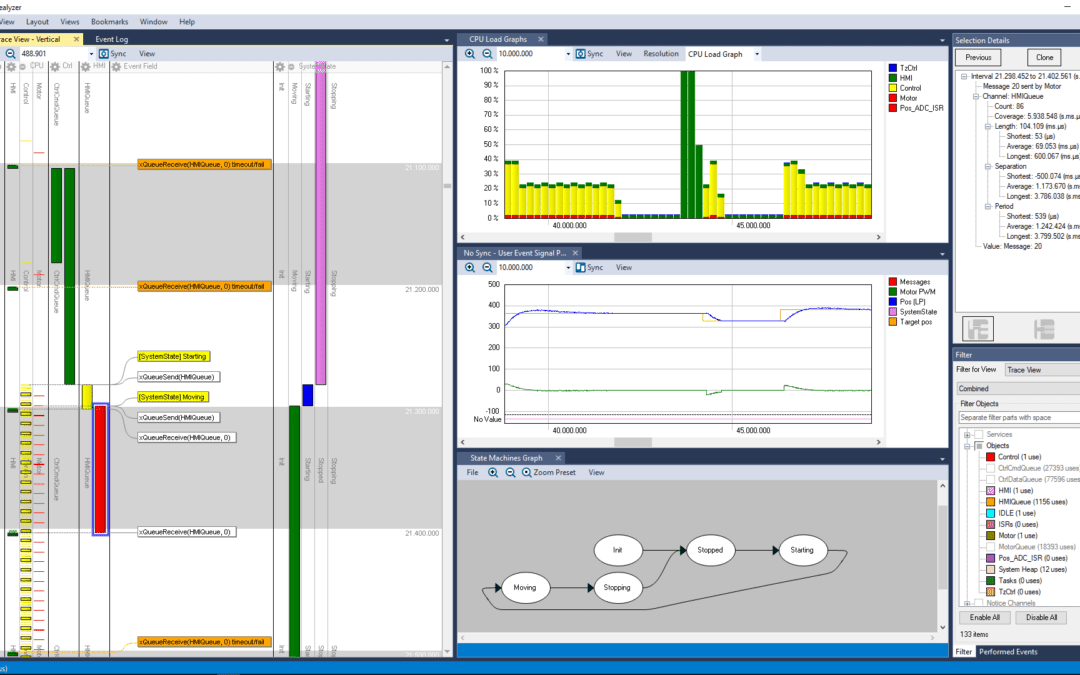
Quite a few embedded software developers don’t know whether their applications meet their timing requirements. In today’s Tracealyzer Hands On post, we will explore how to use Tracealyzer to verify task timing and scheduling.
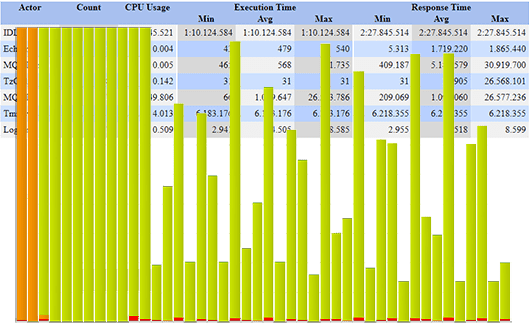
Verifying Task Timing and Scheduling
read more